


Cryptology
Cryptology
Cryptology
Key Screener distills crypto market noise into actionable insights. It highlights volume spikes, CVD/OI divergences, and AI-based macro alerts — helping traders act early, not react late.
MY ROLE
Product Designer
YEAR
2025
TEAM
Designer, PM, 2 Engineers
CEO, PM, R&D, 2 FE,
2 Software Engineers
Key Contributions
Key Contributions
Key Contributions
Key Contributions
End-to-End Product Design. Led the design process from research through information architecture and feature definition.
Visual Workflow System. Developed a unique visual workflow system that balances power with accessibility.
Cross-Functional Collaboration. Facilitated collaboration between business, engineering, and AI research teams
AI Assistant Builder. Designed an innovative AI assistant builder that differentiates the platform
Current Results
Current Results
Current Results
Current Results
Successful Beta Launch. Platform launched in closed beta with multiple enterprise clients actively using the system.
Design System Integration. Engineering team successfully implemented the Align UI design system, accelerating development and ensuring consistent user experience.
User Satisfaction. Beta users rate the platform 4.7/5 for usability and have highlighted the assistant builder as particularly valuable.
Problem Statement
Problem Statement
Problem Statement
Problem Statement
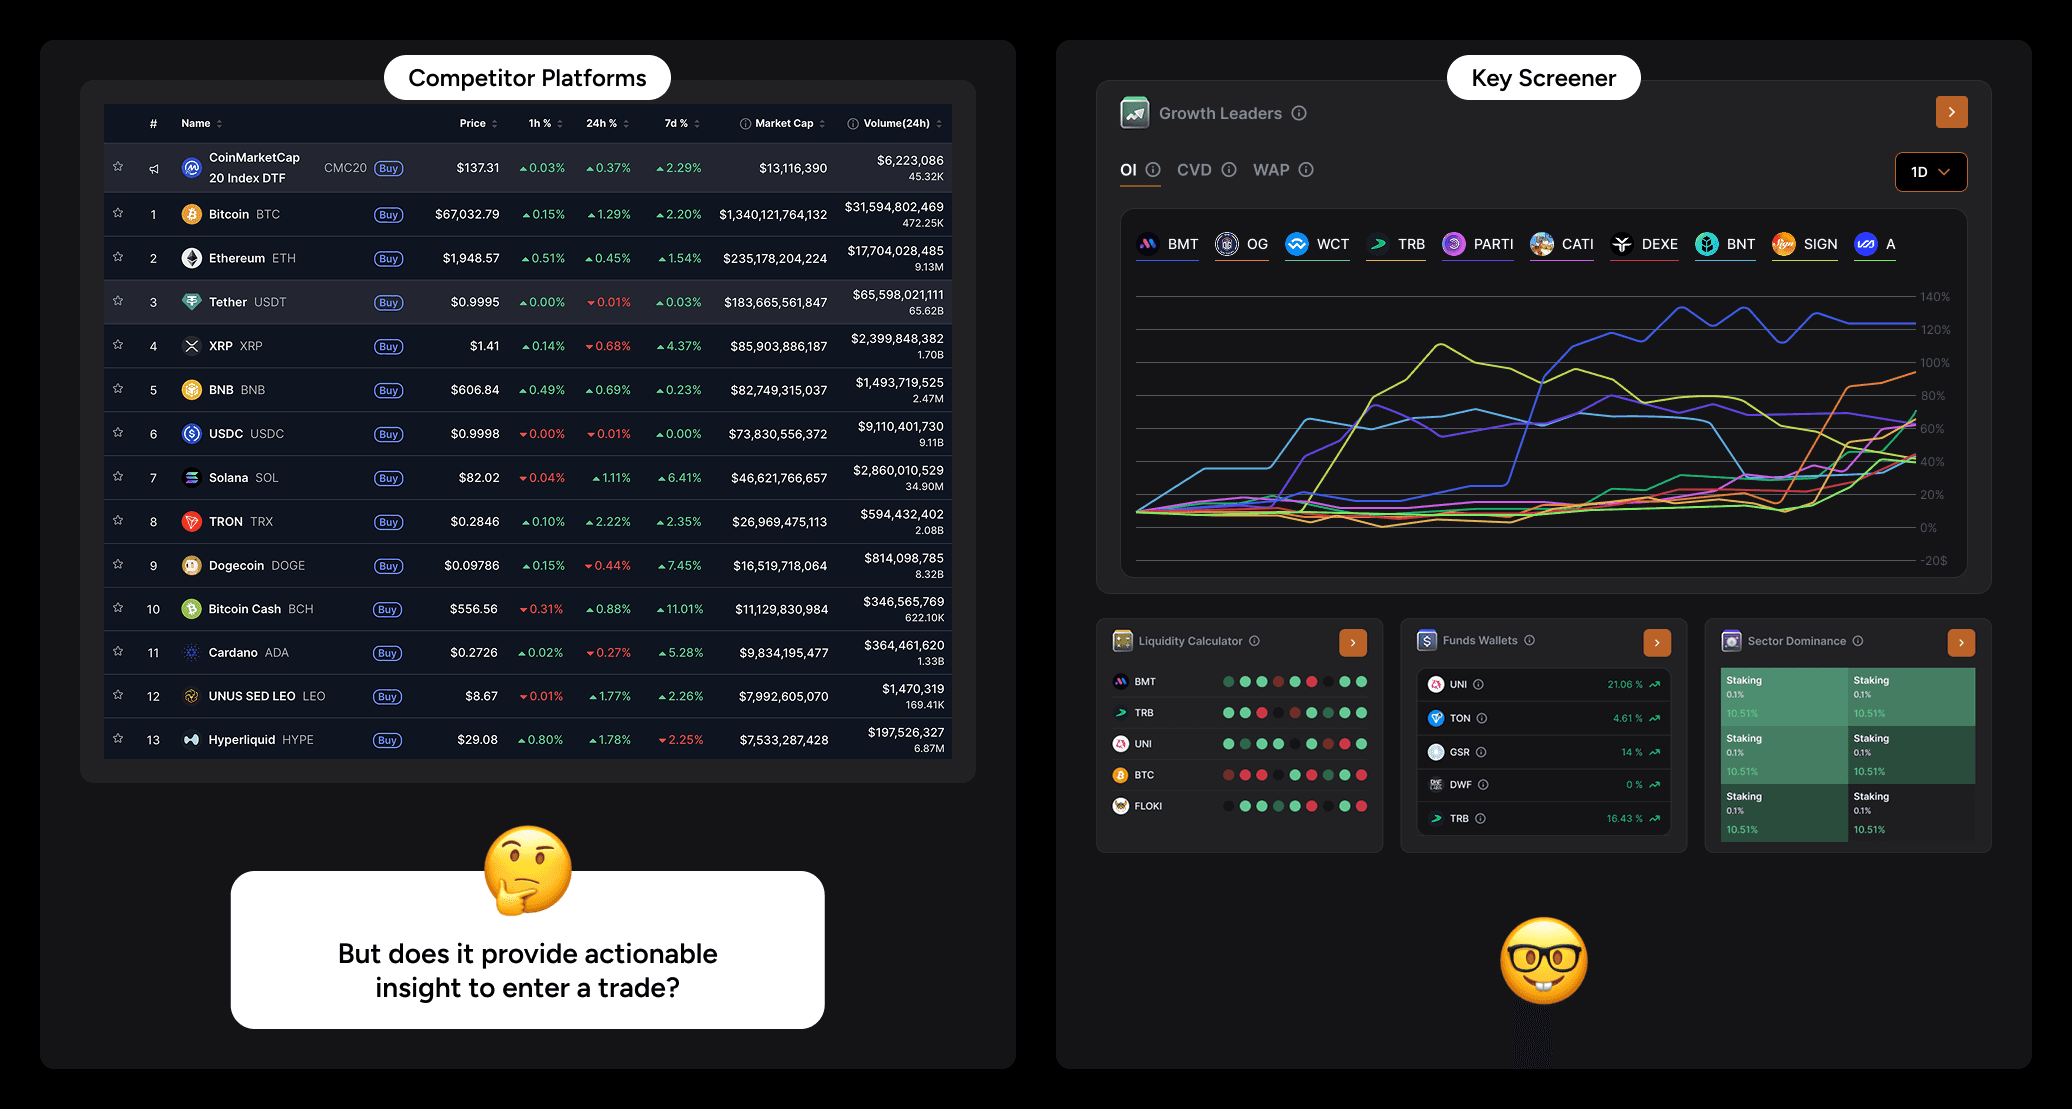
Existing platforms overwhelm traders with raw data and lagging indicators. Key Screener solves this by surfacing predictive, high-signal metrics — including CVD divergences, funding imbalances, and volume anomalies — in a single, modular interface.


Target Users & Jobs To Be Done
Key Screener serves a spectrum of crypto market participants who require speed, clarity, and precision in their analysis workflows.
Primary users include:
Intraday traders, who need to monitor shifts in sentiment, funding, and dominance in near real-time.
Swing traders, who look for mid-horizon signals to validate entry/exit points.
Analysts and fund researchers, who track coin-specific and macro trends for portfolio or content strategies.
Intraday traders, who need to monitor shifts in sentiment, funding, and dominance in near real-time.
Swing traders, who look for mid-horizon signals to validate entry/exit points.
Analysts and fund researchers, who track coin-specific and macro trends for portfolio or content strategies.
Intraday traders, who need to monitor shifts in sentiment, funding, and dominance in near real-time.
Swing traders, who look for mid-horizon signals to validate entry/exit points.
Analysts and fund researchers, who track coin-specific and macro trends for portfolio or content strategies.
Secondary users:
Secondary users:
Secondary users:
Crypto-curious professionals (e.g., finance professionals entering Web3), who seek a structured signal layer above raw price feeds.
Long-term investors validating positions using comparative growth, activity, and trend strength.
Crypto-curious professionals (e.g., finance professionals entering Web3), who seek a structured signal layer above raw price feeds.
Long-term investors validating positions using comparative growth, activity, and trend strength.
Product & Design Goals
User Goals:
User Goals:
User Goals:
Identify high-potential tokens to trade today based on real-time signals.
Reduce decision lag by aligning visual hierarchy with user scan patterns.
Replace fragmented workflows with a unified view of trends, volume, funding, and news.
Identify high-potential tokens to trade today based on real-time signals.
Reduce decision lag by aligning visual hierarchy with user scan patterns.
Replace fragmented workflows with a unified view of trends, volume, funding, and news.
Identify high-potential tokens to trade today based on real-time signals.
Reduce decision lag by aligning visual hierarchy with user scan patterns.
Replace fragmented workflows with a unified view of trends, volume, funding, and news.
Business Goals:
Business Goals:
Business Goals:
Increase daily active engagement through timely, actionable data delivery.
Build product differentiation through transparency and signal strength.
Drive long-term retention via predictive insights, not just retrospective charts.
Increase daily active engagement through timely, actionable data delivery.
Build product differentiation through transparency and signal strength.
Drive long-term retention via predictive insights, not just retrospective charts.
Design System
Design System
Design System
Design System
To ensure consistency and speed throughout the process, I integrated the Align UI design system into Lumus AI.
I incorporated Align UI to streamline workflows, maintain consistency across screens, and accelerate developer handoff. Its production-ready, customizable components allowed me to build cohesive interfaces 2x faster, while reducing design-to-development rework by 30%, enabling cross-team alignment and smoother collaboration.


Design Principles
Design Principles
Design Principles
Signal Over Noise
The UI avoids data for data’s sake. Every chart or module must support a user decision.
Clarity at Speed
Traders don’t read — they scan. Color, shape, and positioning were optimized for pattern detection at a glance.
Confidence Through Structure
Consistent components, smart toggles, and grouped indicators help users stay oriented while moving across timeframes or coins.
Scalability Without Overload
The modular design allows the platform to grow — more metrics, more coins — without adding visual clutter or user fatigue.
UX & Information Architecture Decisions
Key Screener presents a modular, high-density layout where core signals are grouped by decision category: trend velocity, funding shifts, sentiment levels, and growth momentum. This mirrors how traders mentally organize information — by what it means, not where it comes from.
Information is prioritized using visual hierarchy, not quantity:
Software Solution
Primary signals (e.g., volume spikes, funding divergences) are top-level.
Secondary indicators (e.g., social buzz, Google Trends) are grouped below.
Timeframes are toggleable inline, avoiding disruptive reloads or navigation jumps.
Primary signals (e.g., volume spikes, funding divergences) are top-level.
Secondary indicators (e.g., social buzz, Google Trends) are grouped below.
Timeframes are toggleable inline, avoiding disruptive reloads or navigation jumps.
Primary signals (e.g., volume spikes, funding divergences) are top-level.
Secondary indicators (e.g., social buzz, Google Trends) are grouped below.
Timeframes are toggleable inline, avoiding disruptive reloads or navigation jumps.
Each module behaves as a self-contained card, enabling fast scanning and reducing cognitive switching. This design also supports scalability — new signals or tools can be added without disrupting the user’s mental model.
Key Screens Breakdown 1
Scan today’s market conditions across all tracked tokens, assess trend strength, volume anomalies, and key divergence signals, then decide where to focus.
Key Screens Breakdown 1


Trade-offs made:
Trade-offs made:
Trade-offs made:
Trade-offs made:
Trade-offs made:
Price charts are minimized or omitted at the dashboard level to avoid visual overload.
Only high-confidence signals are shown — no moving averages or lagging indicators unless contextually relevant.
Price charts are minimized or omitted at the dashboard level to avoid visual overload.
Only high-confidence signals are shown — no moving averages or lagging indicators unless contextually relevant.
Price charts are minimized or omitted at the dashboard level to avoid visual overload.
Only high-confidence signals are shown — no moving averages or lagging indicators unless contextually relevant.
Cognitive load reduction techniques:
Compact cards with unified timeframes.
Controlled color use (e.g., muted greens/reds for directional indicators, blues for neutrality).
Summary metrics (e.g., “5 tokens with triple divergence today”) instead of raw lists.
Compact cards with unified timeframes.
Controlled color use (e.g., muted greens/reds for directional indicators, blues for neutrality).
Summary metrics (e.g., “5 tokens with triple divergence today”) instead of raw lists.
Compact cards with unified timeframes.
Controlled color use (e.g., muted greens/reds for directional indicators, blues for neutrality).
Summary metrics (e.g., “5 tokens with triple divergence today”) instead of raw lists.
Key Screens Breakdown 2
Assess the state of a specific token, including market structure, sentiment, volume flow, and real-time positioning data.


Trade-offs made:
Trade-offs made:
Trade-offs made:
Trade-offs made:
Trade-offs made:
No basic chart view by default — replaced with positioning and divergence tools.
Price movement is contextualized by intent, not just performance.
No basic chart view by default — replaced with positioning and divergence tools.
Price movement is contextualized by intent, not just performance.
Cognitive load reduction techniques:
Collapsed tabs for Wallets / Liquidity / News to reduce vertical scroll.
“No data” placeholders reduce ambiguity rather than misleading via empty visuals.
Inline date and sentiment markers help orient pattern context without zooming.
Collapsed tabs for Wallets / Liquidity / News to reduce vertical scroll.
“No data” placeholders reduce ambiguity rather than misleading via empty visuals.
Inline date and sentiment markers help orient pattern context without zooming.
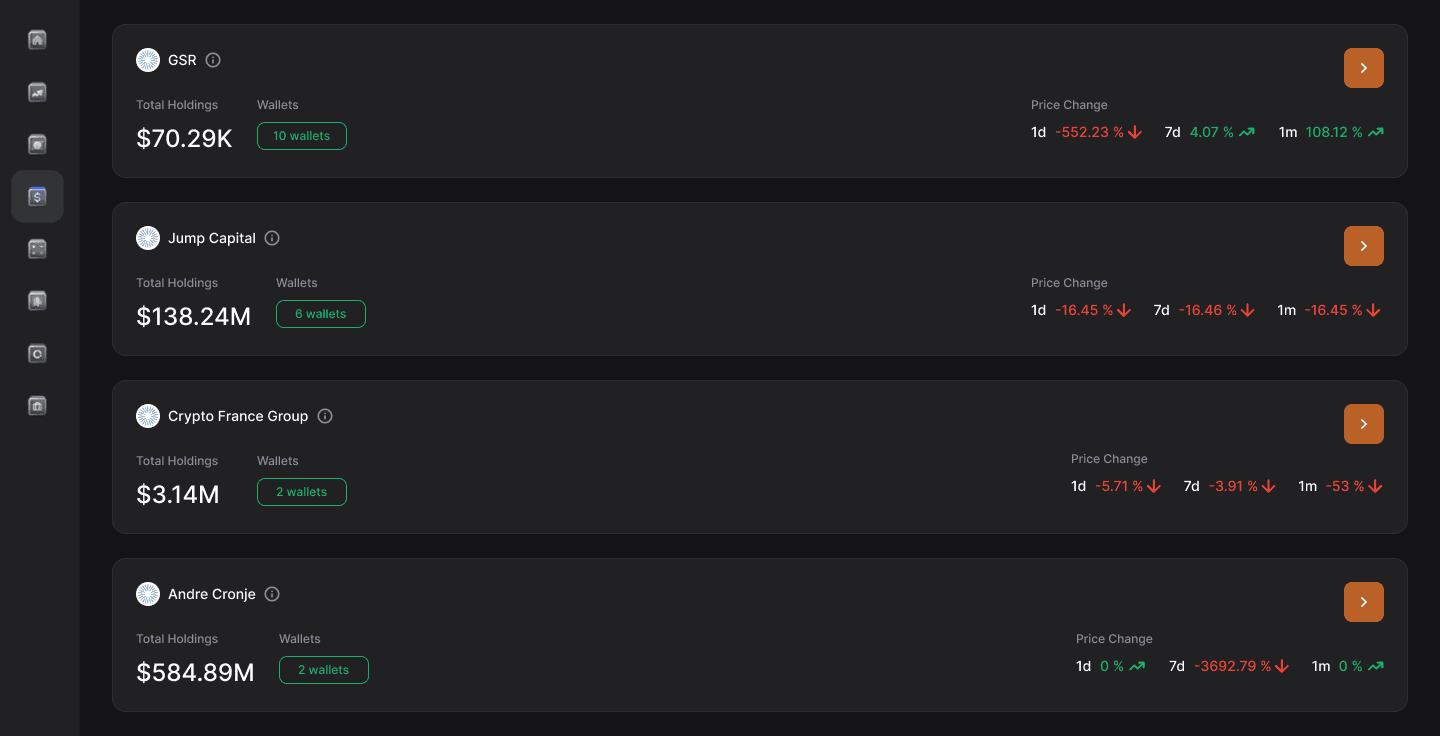
Fund Wallets – “Smart Money” Tracking
Fund Wallet view tracks capital movement across known institutional wallets — helping users front-run large shifts in positioning.
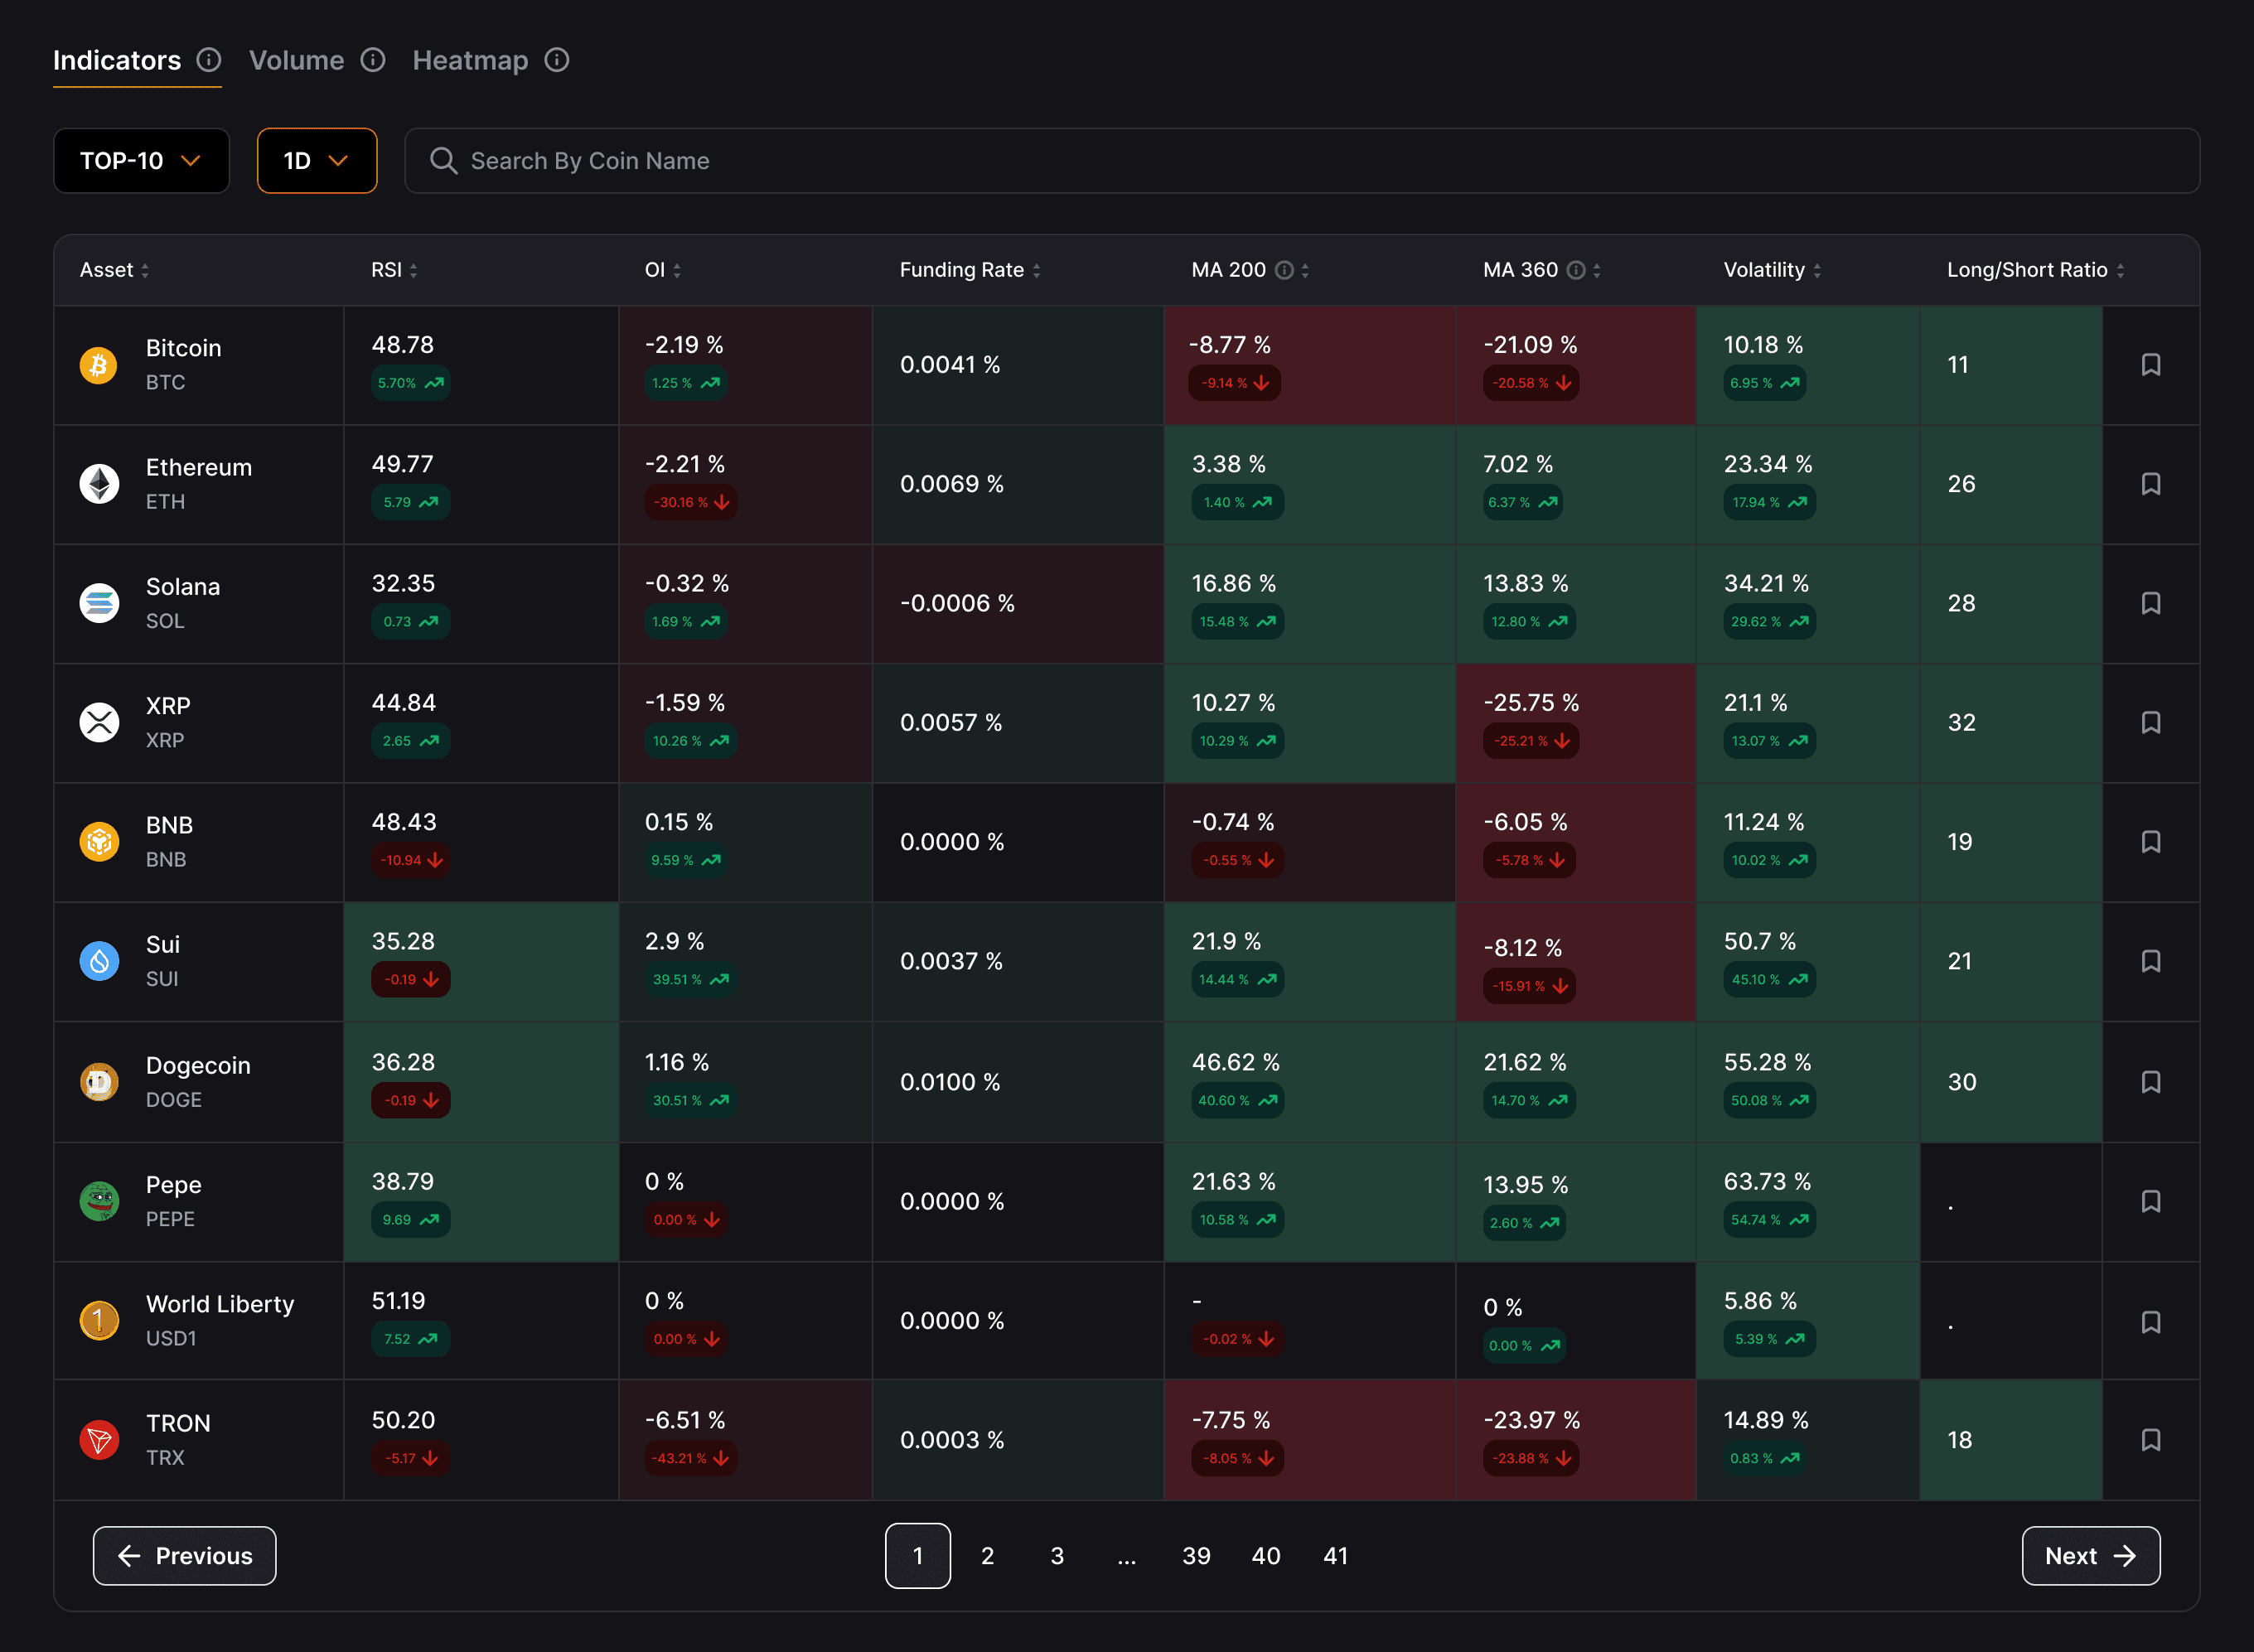


Cognitive load reduction:
Visual grouping by entity.
Use of green/red for growth or decline, with toggleable expansion
Discreet but visible wallet counts to indicate diversification vs. concentration.
Visual grouping by entity.
Use of green/red for growth or decline, with toggleable expansion
Discreet but visible wallet counts to indicate diversification vs. concentration.
Design decision:
Design decision:
Color-coded matrix style supports rapid scanning across indicators and assets. Sorting and pinning add power-user control.
Volumes View
Volumes View
Volumes View
Dig deeper into transactional metrics that drive real movement: liquidity, volume, and CVD.


Heat Map
Heat Map
Heat Map
Detect behavioral clusters and outliers at a glance — especially across sectors or sentiment states.
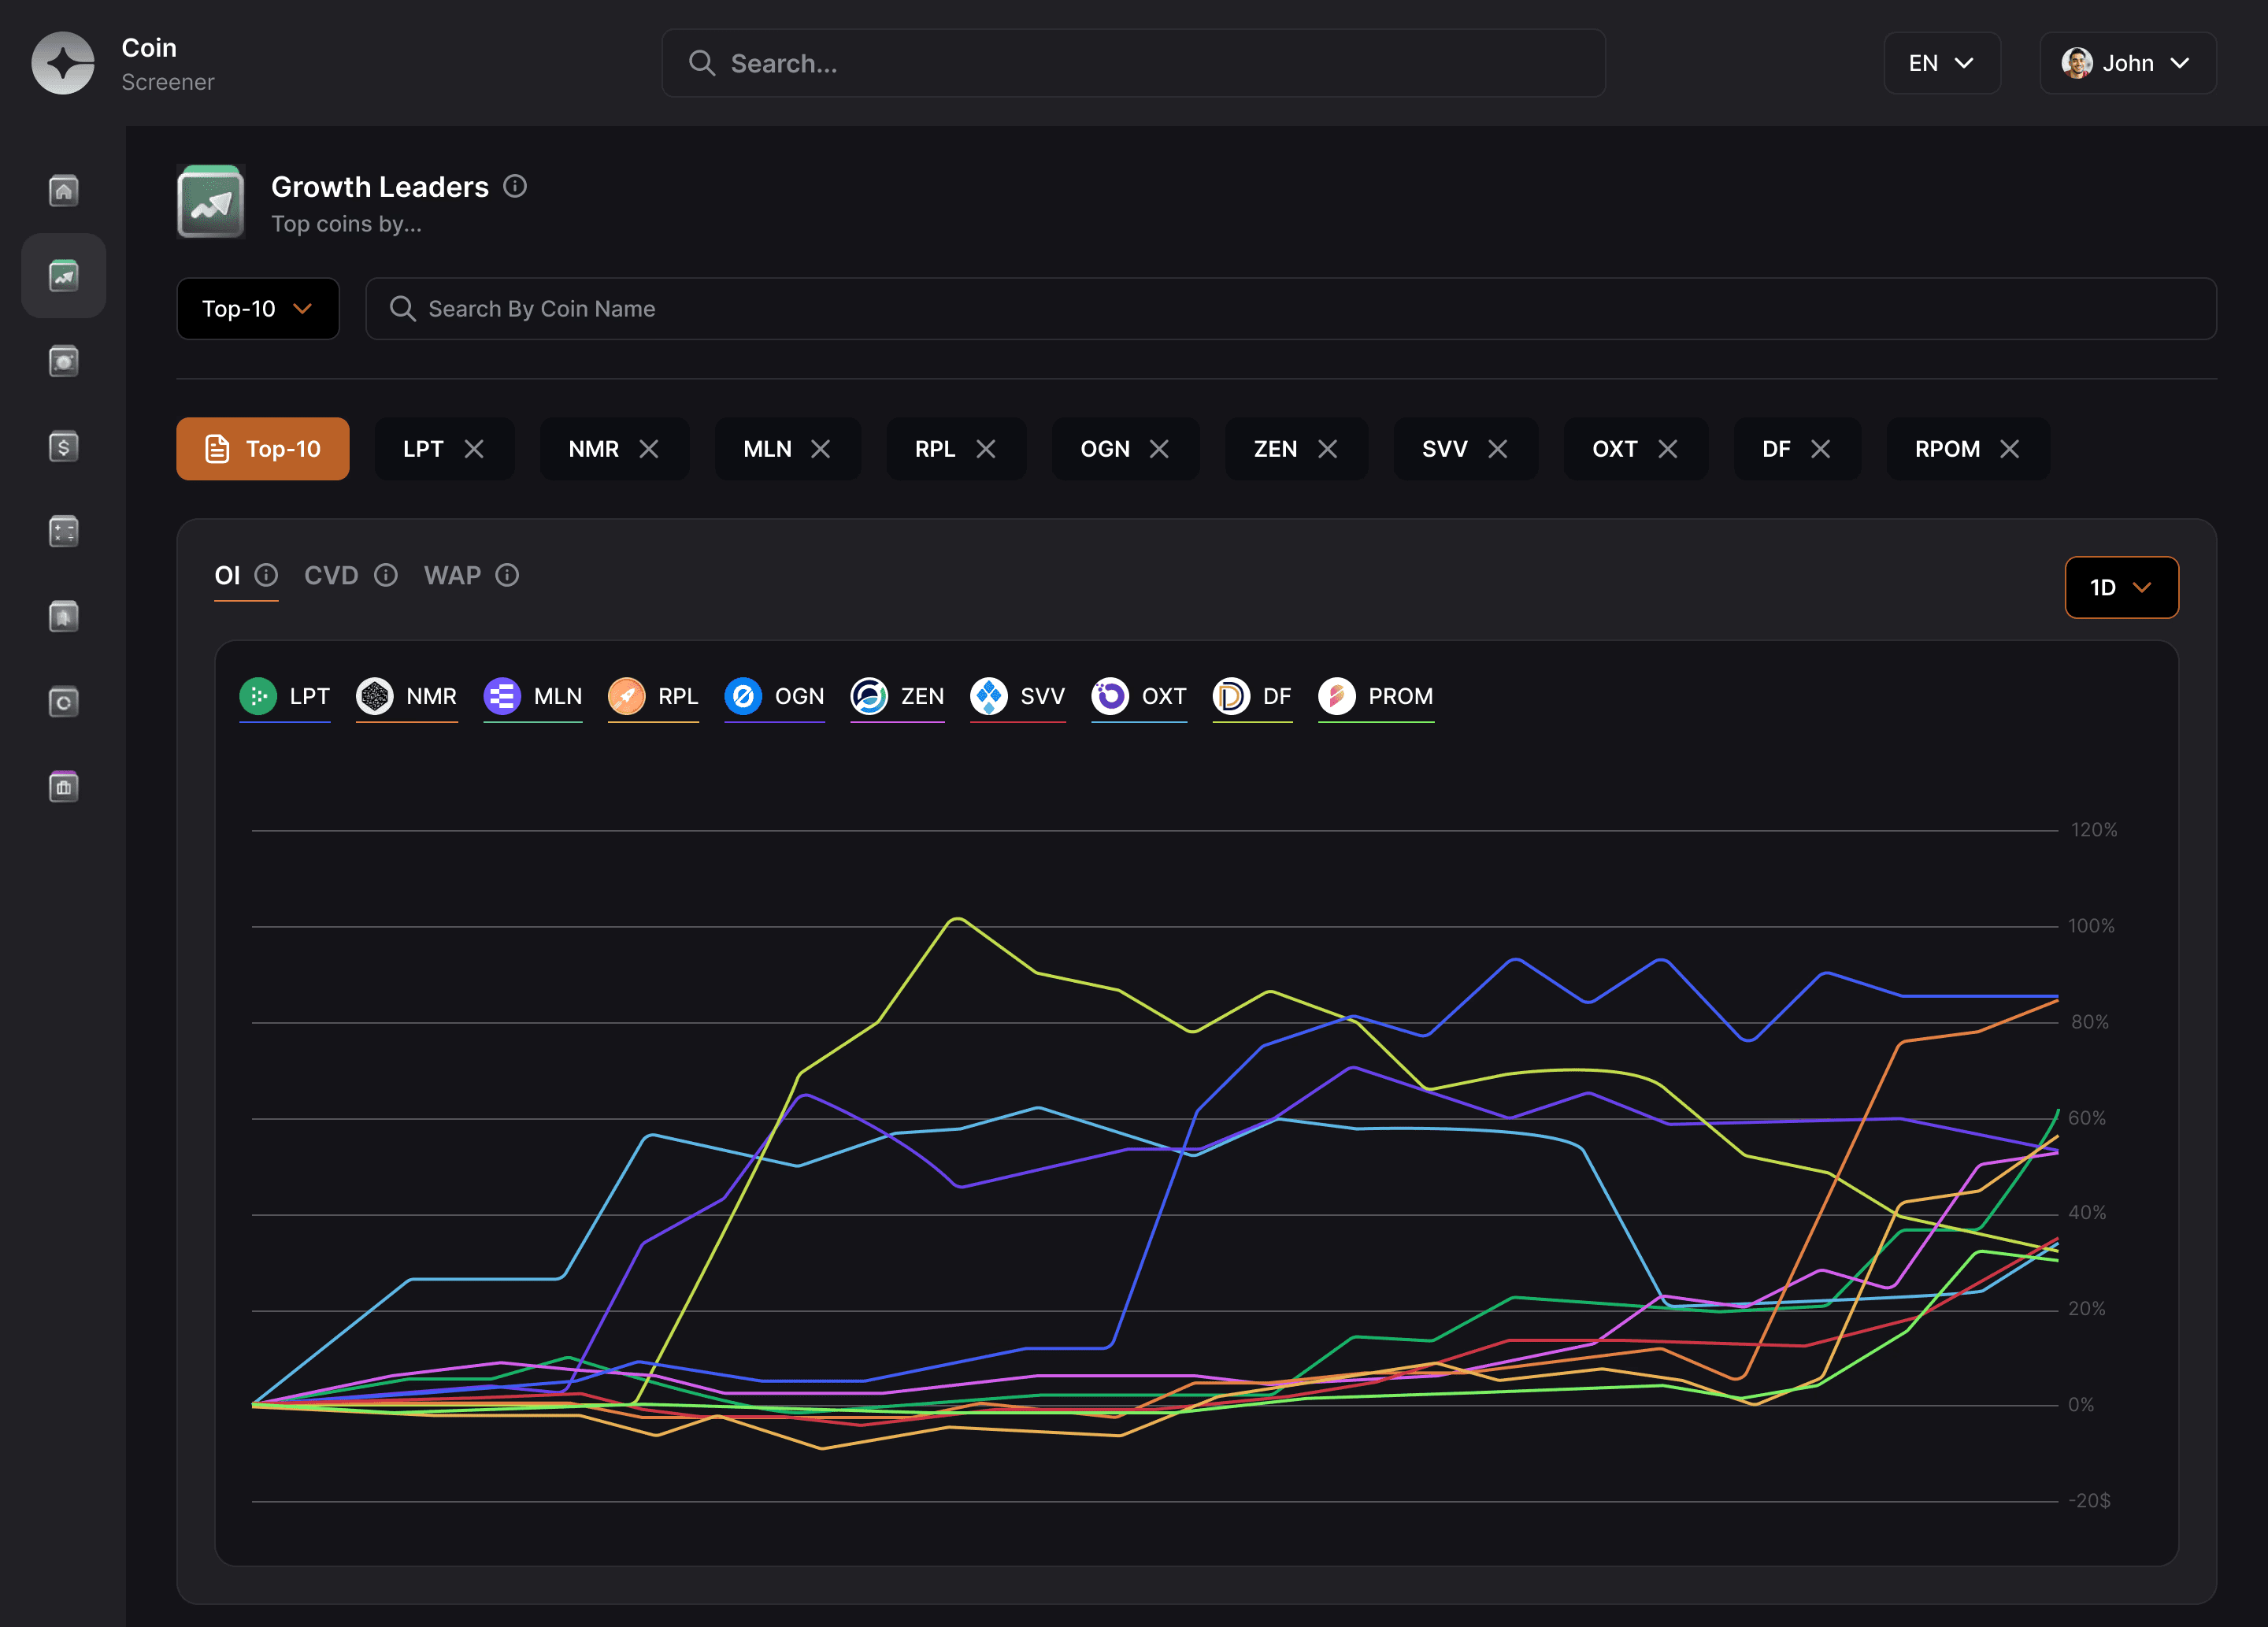


Growth Leaders
Growth Leaders
Growth Leaders
Identify which tokens are outperforming peers across short-term and mid-term horizons, then isolate those with sustained structural momentum.


Trade-offs made:
Trade-offs made:
Trade-offs made:
Trade-offs made:
Trade-offs made:
No static leaderboards — avoids false signals from short-lived pumps
Minimal text — users read the curve, not copy
No static leaderboards — avoids false signals from short-lived pumps
Minimal text — users read the curve, not copy
Cognitive load reduction techniques:
Color-coded coins with matching legends reduce visual re-scanning
Uniform Y-axis scaling to prevent misreading slope severity
Toggle-based interaction minimizes UI complexity for power users
Color-coded coins with matching legends reduce visual re-scanning
Uniform Y-axis scaling to prevent misreading slope severity
Toggle-based interaction minimizes UI complexity for power users
Predominant Sectors
Predominant Sectors
Predominant Sectors
Understand which sectors are gaining/losing dominance — and how capital is reallocating.


Portfolio View
Portfolio View
Portfolio View
Traders want risk awareness, not just balance tracking. This view shows sector exposure, value-at-risk, and position effectiveness — giving clarity without requiring third-party tools.
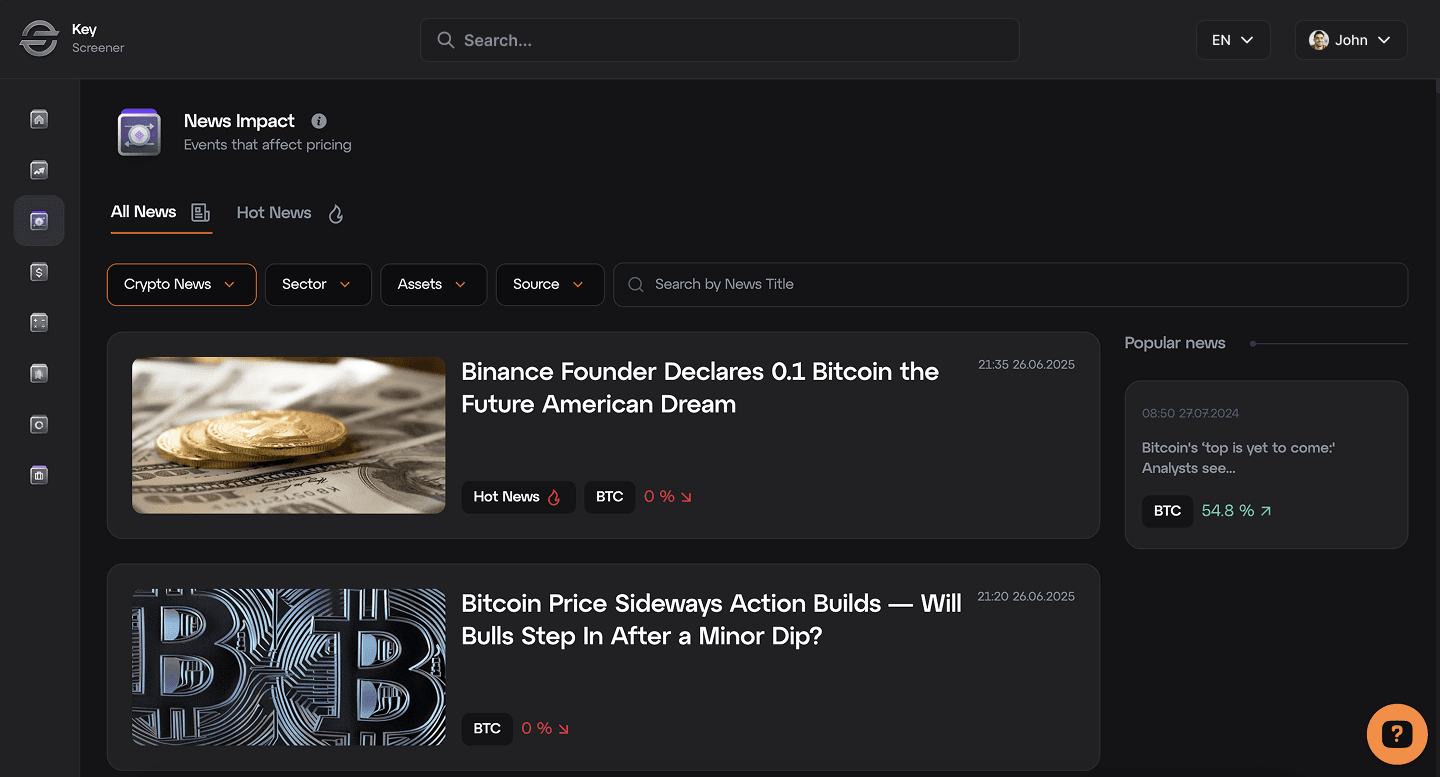


News Impact
News Impact
News Impact
Understand which events, announcements, or narratives are actively moving the market — and how specific assets are reacting


Trade-offs made:
Trade-offs made:
Trade-offs made:
Trade-offs made:
Trade-offs made:
Excludes social media by design — only structured sources included.
No push-based alerts — user pulls what matters when needed.
Cognitive load reduction techniques:
Binned categories (Macro, Token, Sector) provide immediate orientation.
Minimalist cards with headlines + 1-sentence insight.
Sentiment trend arrows show news trajectory without requiring full read.
Data Visualization & UX Rationale
Key Screener is not a charting tool — it’s a signal delivery system. Every visual component was selected based on one question: How fast can this help a user detect, validate, or reject a trading idea?
We avoided traditional candle charts at the dashboard level. Instead, those are embedded within the Coin Page, where technical analysis may be appropriate — but always alongside positioning and sentiment tools.
Color & Contrast Logic
In volatile markets, color is not decoration — it’s cognitive load. Our system uses color as a signal hierarchy:
Greens/Reds are reserved for directional indicators (price delta, sentiment shift).
Blues indicate positioning signals or neutral data.
Grays/Monochrome indicate inactive, default, or non-alert states.
Greens/Reds are reserved for directional indicators (price delta, sentiment shift).
Blues indicate positioning signals or neutral data.
Grays/Monochrome indicate inactive, default, or non-alert states.
We applied minimal saturation to avoid over-triggering the user’s attention — especially in dark mode, where high-chroma colors can fatigue the eye or overstate a signal.
Icons and UI chrome were similarly subdued, giving visual priority to charted data and module content.
Pattern Detection Support
Most users aren't reading charts — they’re scanning for patterns. We designed all visuals with these principles in mind:
Uniform axis scaling across comparative charts to avoid misreading slope or growth
Persistent toggles (OI, CVD, WAP) allow side-by-side driver analysis without context switching
Temporal alignment of news and data charts allows cause-effect relationships to surface visually
Microcopy and summaries (e.g., “5 tokens with triple divergence today”) act as pattern previews
This supports fast filtering of which signals deserve deeper attention — and which can be dismissed.
Accessibility & Dark Mode Strategy
Dark mode is the default — not for style, but for clarity. High-density dashboards are easier to parse when light isn’t competing with signal.
We ensured:
Dark mode is the default — not for style, but for clarity. High-density dashboards are easier to parse when light isn’t competing with signal.
We ensured:
Sufficient contrast ratios for all text, icons, and chart lines
Consistent color logic across modules to support visual memory
Non-reliance on hue alone — icons, labels, and chart structure support interpretation for colorblind users
Sufficient contrast ratios for all text, icons, and chart lines
Consistent color logic across modules to support visual memory
Non-reliance on hue alone — icons, labels, and chart structure support interpretation for colorblind users
Tooltips, legends, and state changes were tested at low brightness to ensure clarity even in edge-case viewing environments.
Summary
Summary
Summary
Summary
Key Screener compresses time-to-insight. It turns fragmented crypto data into structured, decision-ready signals — helping professionals act faster, with more confidence, and less noise.
Takeaways
Takeaways
Takeaways
Takeaways
✅
Always start with information architecture. Creating a
solid foundation for the complex feature set ensured a coherent user experience.
Always start with information architecture. Creating a
solid foundation for the complex feature set ensured a coherent user experience.
Always start with information architecture. Creating a
solid foundation for the complex feature set ensured a coherent user experience.
✅
Early design system saved dev time
Prevented UI rework and enabled faster,
more consistent delivery.
Early design system saved dev time
Prevented UI rework and enabled faster,
more consistent delivery.
Early design system saved dev time
Prevented UI rework and enabled faster,
more consistent delivery.
✅
Balancing power and accessibility
Progressive disclosure and thoughtful defaults made complex capabilities approachable.
Balancing power and accessibility
Progressive disclosure and thoughtful defaults made complex capabilities approachable.
Balancing power and accessibility
Progressive disclosure and thoughtful defaults made complex capabilities approachable.
✅
Early engineering collaboration. Partnering with engineers from the concept phase ensured technical feasibility and smoother implementation of complex features.


